Requirements
1. Knowledgable on Pullback strategy ( S Pattern)
2. Knowledgable on Fractal Strategy
3. Knowledgable on MA crossover
Tools
1. MA 20 and 50 (cross over)
2. MACD (confirm cross over)
3. Fractal (Entry Point , Stop Lost)
4. Fibanocci (Identify Retracement)
Plus Factor
1. Support and Ressitance on Multi time frame
2. Pattern trader
Rules and Guide
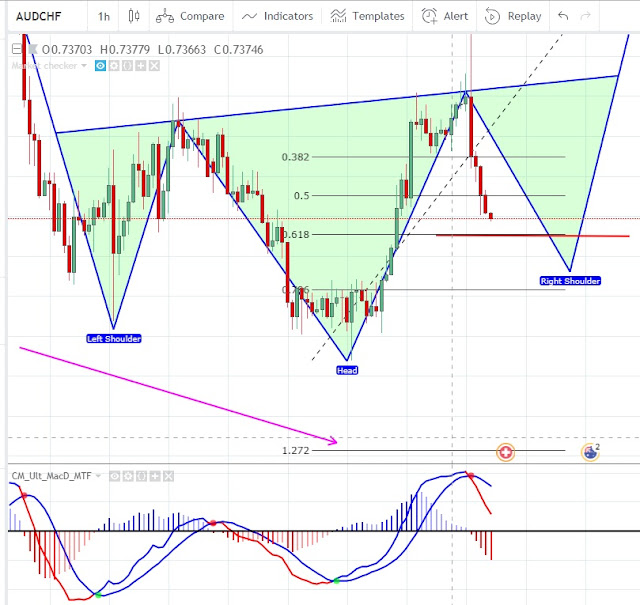
1. Full Head and shoulders is form
2. Get the neckline Horizontal and Diagonal if Head and shoulders is in diagonal
3. Neckline to Right shoulder mark as the Head of S pattern
4. Right shoulder is the Wings of S pattern
(To Identify Potential Retracement after neckline)
5. Get Fib Extension and measure the Neckline to Right shoulder
6. Identify 1.27 and 1.618 extension a guide that the market will retrace back to neckline
7. The feet of the S Pattern start in 1.27 minimum and Maximum 1.618
8 Measure Right Shoulder to Feet to get Area of Potential entry point 38.20% to 61.80%
(Confirmation of entry point)
9. Feet is on 1.27 minumum area Max 1.618
10 Retrace between 38.20% Min Max to 61.80% (tail of the S pattern)
11. Proceed to 15min time frame Find Crossover 20 and 50 MA
.Macd must support Crossover above 0 for cross over up below 0 Cross over down
IMPORTANT
(find crossover that MACD support befor proceed on next confirmation)
12.Turn on Fractal to identify potential entry
13. Entry right after 2nd Retest Stop lost on Rejection
14. Retest and Rejection fractual must not be greater than 30pips
(MUST TO DO)
Retracement 38.20% will give you Entry point but be aware that maket could move retracement to 61.80%.
1. Always Move Stop Lost to the Profitable location once you reach the Price that you Risk.
Saturday, December 8, 2018
Friday, September 7, 2018
Money Management Strategy
The Goal is to be Aggresive in trading than can Gain $300 to $500
Type of trader Applicable = ANY TYPE
Rules
1. Must be applied to the Proven Consistent System and Strategy
2. Well Versed on Money Managment System.
3. Only Use this during the week where Trade Plan is in the peak
4. Lot Size must be Equivalent amount of the pips that you are willing to loose.
5. Do not Gamble by adding amount of capital just to perform this trade.
Risk level = High
Disadvantage =
1.Thin line between Gambling and Trading
2. Lost everything you save for this event
Benefits
1. Increase your trade size without hurting your capital
2. High Frequency trading with NO RISK!!!!
3. 2nd Proven Strategy.
Sunday, September 2, 2018
94% Success Rate on Strategy
The Very reason why I really recommend you to create journal is for you to assest yourself on what to work on and also for you to be able to see your progress. The most important on the journal is to be able to measure
- Percentage Profitable as a Trader
- Strategy Success rate'
With this basic needs to derive report you will be able to do some adjustments that will lead you to consistency. I really do believe in Consistent Analysis + Consistent Strategy = Consistent Profit.
Due to the fact that market are not really thesame as what it was yesterday or day before commonly we tend to bend are analysis so that we can profit. by doing so we also bend our Strategy which leads to a trap. In the end you will be chasing the market.
on the Video below explaining my progress report for the month of August which I can prove to you that I was able to create a 94% success rate on Strategy. Watch the Video
Saturday, August 25, 2018
codes to detect Rejection and Retest
//Codes by Chrismoody
study(title="CM_Williams_Vix_Fix_V3_Upper_Text-Plots", shorttitle="Market checker", overlay=true)
//Inputs Tab Criteria.
pd = input(22, title="LookBack Period Standard Deviation High")
bbl = input(20, title="Bolinger Band Length")
mult = input(2.0 , minval=1, maxval=5, title="Bollinger Band Standard Devaition Up")
lb = input(50 , title="Look Back Period Percentile High")
ph = input(.85, title="Highest Percentile - 0.90=90%, 0.95=95%, 0.99=99%")
new = input(false, title="-------Text Plots Below Use Original Criteria-------" )
sbc = input(false, title="Market Check")
sbcc = input(false, title="Show Text Plot if Buttom")
new2 = input(false, title="-------Text Plots Below Use FILTERED Criteria-------" )
sbcFilt = input(true, title="Show Text Plot For Filtered Entry")
sbcAggr = input(true, title="Show Text Plot For AGGRESSIVE Filtered Entry")
ltLB = input(40, minval=25, maxval=99, title="Long-Term Look Back Current Bar Has To Close Below This Value OR Medium Term--Default=40")
mtLB = input(14, minval=10, maxval=20, title="Medium-Term Look Back Current Bar Has To Close Below This Value OR Long Term--Default=14")
str = input(3, minval=1, maxval=9, title="Entry Price Action Strength--Close > X Bars Back---Default=3")
//Alerts Instructions and Options Below...Inputs Tab
new4 = input(false, title="-------------------------Turn On/Off ALERTS Below---------------------" )
new5 = input(false, title="----To Activate Alerts You HAVE To Check The Boxes Below For Any Alert Criteria You Want----")
sa1 = input(false, title=" choose what to alert")
sa2 = input(false, title="Market Check?")
sa3 = input(false, title="Confirm Entry?")
sa4 = input(false, title="Aggresive Entry?")
//Williams Vix Fix Formula
wvf = ((highest(close, pd)-low)/(highest(close, pd)))*100
sDev = mult * stdev(wvf, bbl)
midLine = sma(wvf, bbl)
lowerBand = midLine - sDev
upperBand = midLine + sDev
rangeHigh = (highest(wvf, lb)) * ph
wvf = ((highest(close, pd)-low)/(highest(close, pd)))*100
sDev = mult * stdev(wvf, bbl)
midLine = sma(wvf, bbl)
lowerBand = midLine - sDev
upperBand = midLine + sDev
rangeHigh = (highest(wvf, lb)) * ph
//Filtered Bar Criteria
upRange = low > low[1] and close > high[1]
upRange_Aggr = close > close[1] and close > open[1]
//Filtered Criteria
filtered = ((wvf[1] >= upperBand[1] or wvf[1] >= rangeHigh[1]) and (wvf < upperBand and wvf < rangeHigh))
filtered_Aggr = (wvf[1] >= upperBand[1] or wvf[1] >= rangeHigh[1]) and not (wvf < upperBand and wvf < rangeHigh)
//Alerts Criteria
alert1 = wvf >= upperBand or wvf >= rangeHigh ? 1 : 0
alert2 = (wvf[1] >= upperBand[1] or wvf[1] >= rangeHigh[1]) and (wvf < upperBand and wvf < rangeHigh) ? 1 : 0
alert3 = upRange and close > close[str] and (close < close[ltLB] or close < close[mtLB]) and filtered ? 1 : 0
alert4 = upRange_Aggr and close > close[str] and (close < close[ltLB] or close < close[mtLB]) and filtered_Aggr ? 1 : 0
plotshape(sbcc and alert1 ? alert1 : na, title="WVF Is True Text", color=lime, style=shape.arrowup, location=location.belowbar ,text='Buttom', transp=0)
plotshape(sbc and alert2 ? alert2 : na, title="Entry/Rev Text", color=aqua, style=shape.arrowup, location=location.belowbar ,text='Entry/Rev', transp=0)
plotshape(sbcAggr and alert4 ? alert4 : na, title="Early in/Rev Text",color=orange, style=shape.arrowup, location=location.belowbar ,text='Early in/Rev', transp=0)
plotshape(sbcFilt and alert3 ? alert3 : na, title="Confirm Entry/Rev Text", color=fuchsia, style=shape.arrowup, location=location.belowbar ,text='confirm entry/Rev', transp=0)
// Find all Fractals.
// This section based on [RS]Fractal Levels by RicardoSantos
hidefractals = input(false)
hidelevels = input(false)
topfractal = high[2] > high[1] and high[2] > high and high[2] > high[3] and high[2] > high[4]
botfractal = low[2] < low[1] and low[2] < low and low[2] < low[3] and low[2] < low[4]
// This section based on [RS]Fractal Levels by RicardoSantos
hidefractals = input(false)
hidelevels = input(false)
topfractal = high[2] > high[1] and high[2] > high and high[2] > high[3] and high[2] > high[4]
botfractal = low[2] < low[1] and low[2] < low and low[2] < low[3] and low[2] < low[4]
plotshape(hidefractals ? na : topfractal, color=green, transp=0, style=shape.triangleup, location=location.abovebar, offset=-2, size=size.tiny)
plotshape(hidefractals ? na : botfractal, color=red, transp=0, style=shape.triangledown, location=location.belowbar, offset=-2, size=size.tiny)
plotshape(hidefractals ? na : botfractal, color=red, transp=0, style=shape.triangledown, location=location.belowbar, offset=-2, size=size.tiny)
topfractals = topfractal ? high[2] : topfractals[1]
botfractals = botfractal ? low[2] : botfractals[1]
botfractals = botfractal ? low[2] : botfractals[1]
topfcolor = topfractals != topfractals[1] ? na : green
botfcolor = botfractals != botfractals[1] ? na : red
botfcolor = botfractals != botfractals[1] ? na : red
plot(hidelevels ? na : topfractals, color=topfcolor, transp=0, linewidth=2)
plot(hidelevels ? na : botfractals, color=botfcolor, transp=0, linewidth=2)
plot(hidelevels ? na : botfractals, color=botfcolor, transp=0, linewidth=2)
//Coloring Criteria of Williams Vix Fix
col = wvf >= upperBand or wvf >= rangeHigh ? lime : gray
col = wvf >= upperBand or wvf >= rangeHigh ? lime : gray
//Plots for Williams Vix Fix Histogram and Alerts
plot(sa2 and alert2 ? alert2 : 0, title="Alert If Entry/Rev", style=line, linewidth=2, color=aqua)
plot(sa3 and alert3 ? alert3 : 0, title="Alert Confirm Entry/Rev", style=line, linewidth=2, color=fuchsia)
plot(sa4 and alert4 ? alert4 : 0, title="Alert Early in/Rev", style=line, linewidth=2, color=orange)
matype = input(defval="HullMA", title="Fast MA Type: SMA, EMA, WMA, VWMA, SMMA, DEMA, TEMA, HullMA, TMA, ZEMA ( case sensitive )", type=string)
malength = input(defval=20, title="Moving Average Length", minval=1)
src = input(close,title="Moving average Source")
malength = input(defval=20, title="Moving Average Length", minval=1)
src = input(close,title="Moving average Source")
// Returns MA input selection variant, default to SMA if blank or typo.
variant(type, src, len) =>
v1 = sma(src, len) // Simple
v2 = ema(src, len) // Exponential
v3 = wma(src, len) // Weighted
v4 = vwma(src, len) // Volume Weighted
v5 = na(v5[1]) ? sma(src, len) : (v5[1] * (len - 1) + src) / len // Smoothed
v6 = 2 * v2 - ema(v2, len) // Double Exponential
v7 = 3 * (v2 - ema(v2, len)) + ema(ema(v2, len), len) // Triple Exponential
v8 = wma(2 * wma(src, len / 2) - wma(src, len), round(sqrt(len))) // Hull
ema1 = ema(src, len)
ema2 = ema(ema1, len)
v10 = ema1+(ema1-ema2) // Zero Lag Exponential
v11 = sma(sma(src,len),len) // Trianglular
// return variant, defaults to SMA if input invalid.
type=="EMA"?v2 : type=="WMA"?v3 : type=="VWMA"?v4 : type=="SMMA"?v5 : type=="DEMA"?v6 : type=="TEMA"?v7 : type=="HullMA"?v8 : type=="ZEMA"?v10 : type=="TMA"?v11 : v1
// Calculate selected MA and get direction of trend from it.
zlema= variant(matype,src,malength)
zlema= variant(matype,src,malength)
up = zlema > zlema[1] ? 1 : 0
down = zlema < zlema[1] ? 1 : 0
down = zlema < zlema[1] ? 1 : 0
// This section based on Candlestick Patterns With EMA by rmwaddelljr
//
ufb = input(false, title="Use Fractal S/R Cross Patterns")
udc = input(true, title="Use Dark Cloud Cover Patterns" )
upl = input(true, title="Use Piecing Line Patterns" )
ube = input(true, title="Use Engulfing Candle Patterns" )
ubh = input(true, title="Use Harami Candle Patterns" )
upb = input(true, title="Use Defined PinBar Patterns")
pctP = input(66, minval=1, maxval=99, title="Directional PBars, % of Range of Candle the Long Wick Has To Be")
// This section based on CM_Price-Action-Bars by ChrisMoody
//EOF
Sunday, August 19, 2018
How to Detect Head and Shoulders
System In Detecting Potential Head and shoulders
Tools
1. CM_Ult_Macd = detect divergence and crossover confirmation
2. RSI = detect divergence
Skills needed
1. Support And Resistance
2. ABCD Pattern
Rules
1. Shoulders must be Below the Head
2. Start of neckline must above Point A or at the point A.
Find the the key factor.
1. ABCD Points or ABC
To give you more idea about ABCD Pattern watch this Video
2. Confirm the ABCD Points to the Cross over of the MACD
3. Detect Divergent by using RSI or MACD in which B point is the Shoulder and D point is the head
4. Let ABCD points be the guide of your support and Resistance
Tuesday, August 7, 2018
Sniper trading
Profit from 4hrs Consilidation
System
1. In 4hrs time frame find specific Consolidation With Rejection and Retest
Requirements 4 candle stick above
Body of 2 candle stick will have same height
Rejection Retest with in the structure


5. Proper Head and shoulder must be form if fail no trade
STRATEGY


There will be add ons on both system and strategy if ever i could live trade in this. so be advice i have not yet use this on LIVE ACCOUNT.
System
1. In 4hrs time frame find specific Consolidation With Rejection and Retest
Requirements 4 candle stick above
Body of 2 candle stick will have same height
Rejection Retest with in the structure


2. Form Head and Shoulder 1hr in which the Retest is the HEAD
3. Wait for Rejection of the 1hr to be the Right shoulder
4. Time to time Check if it is forming Head and shoulder in 1 hr5. Proper Head and shoulder must be form if fail no trade
1. entry below Neck line or below structure 1hr
2. Entry must close below neckline to be safe from bounce
3. Stop Lost will be exactly the shoulder
4. Measurement 30 pips below from neckline to right shoulder
5. Double trade which first trade is the number of pips from neckline to shoulder
6. Second trade is the full structure of 1hr


There will be add ons on both system and strategy if ever i could live trade in this. so be advice i have not yet use this on LIVE ACCOUNT.
Friday, August 3, 2018
Trade Plan Aug 3
EurAud HS 1hr
UsdChf Divergent 4hrs
AudJpy HS 4hrs
EURAUD
Time Frame = 1hr
Divergent = No
.618 = waiting
Rejection =
Retest =
15 min =
MACD confirm =
No pips SL to EP =
NOTE = trend line daily and head and shoulders weekly

UsdCHF
Time Frame = 4hrs
Divergent = Yes
.618 = waiting
Rejection =
Retest =
15 min =
MACD confirm =
No pips SL to EP =

AudJpy
Time Frame = 4hrs
Divergent = No
.618 = waiting
Rejection =
Retest =
15 min =
MACD confirm =
No pips SL to EP =

Wednesday, August 1, 2018
How to Identify your Strength In Trading
My Recorded Trades
A Detail Journal since it was recorded in video both win and Lost Trade But To Extract Progress report are not visible Not Recommend (HUWAG TULARAN AABOTIN KAYO NG 3years)
Recomended Way to Extract Progress Report
- You Can easily distinguished the Relationship of your Lost trade to Your Strategy and System
- Extracr total number of trade plan, Trade Executed, Win and Lost Trade
- Identify Number of pips in Win and Lost trade
- Can identify where the problem is System?, Strategy? You your self
- Type of trade and time frame
- Can easily locate scenario that you always win and loose
Example Below

To be able to know your strength better dig deep on this 5 basic tradings.
1. Do some Research on this 5 basic foundation
A. Support and Ressistance (Choose time frame thta is easy for you)
B. Fibonacci (Choose Pattern that is easy for you to apply fibonacci)
C. Candle Stick (Identify Candle that will provide direction)
D. Moving Average (Understand different value and select that will fit you)
E. Fundamental (RESEARCH)
2. Apply those learning on the market by back testing and creating trade plan, Execute a trade
3. Combine those basic trading to derive Trade plan find what is easy for you
Easiest way you can understand the market flow
Easisest way you can derive strategy to trade.
4. Journal everything including the lost trade, Make sure you documented the most number of win trade with detail reasons on it
5. Do not focus on winning a trade or the amount of dollars you create, to avoid being trap in gambling but focus how you prepare it (system), How you Execute it(strategy).
The longer you spend time on different basic trading the bigger your understanding of the market and the easier you could create system, and a strategy that can support your system. provided you focus on the basics that is easy for you to understand. to avoid confussion on your system and simplicity on your strategy.
After Months or Weeks of Gathering data you will be able to see the best trades that you create and the worst trades you made. through this you will be able to understand your strength on Trading. and what to avoid on trading. Focus on your strength and figure out how you are going to have.
1. Consistent Analysis (Your system no short cut)
2. Uniform Execution of trades (your strategy)
3. Consistent Result.
You will know that it is your strength because you can easily explain your win and lost trade.
NOTE
It will be a big help to find Coach that have the same strength that you have.
Combine basic trading can help but also can confuse you. so make it simple as possible.
Example Combine Candle stick 1hr time frame to Support and Ressistance 15min will confuse me.
Thursday, July 26, 2018
Trade Plan July 26
CADJPY

Time Frame = 1hr
Divergent = Yes
.618 = .382
Rejection =
Rejection =
Retest =
15 min =
MACD confirm
No. Pips from EP to SL =
No. Pips from EP to SL =
==============================================
EURCHF

Time Frame = 4hrs
Divergent = NO
.618 = .382
Rejection =
Rejection =
Retest =
15 min =
MACD confirm
No. Pips from EP to SL =
No. Pips from EP to SL =
================================================
GBPAUD

Time Frame = 1hr
Divergent = Yes
.618 = .382
Rejection =
Rejection =
Retest =
15 min =
MACD confirm
No. Pips from EP to SL =
No. Pips from EP to SL =
==========================================
GBPCHF

Time Frame = 4hr
Divergent = No
.618 = .382
Rejection =
Rejection =
Retest =
15 min =
MACD confirm
No. Pips from EP to SL =
No. Pips from EP to SL =
Wednesday, July 25, 2018
Trade Plan july 25
AUDJPY Divergent 1hr
AUDCHF Divergent 1hr
EURUSD Divergent 4hrs
AUDCHF
.618 = yes
Rejection = yes
Retest = yes
Number of pis SL to EP = 28
 NO TRADE
Time Frame = 1hr
Rejection =
Retest =
Number of pis SL to EP =

NO TRADE
Time Frame = 4hr
Rejection =
Retest =
Number of pis SL to EP =
AUDCHF Divergent 1hr
EURUSD Divergent 4hrs
AUDCHF

WIN TRADE
Time Frame = 1hr
Divergent = YesTime Frame = 1hr
.618 = yes
Rejection = yes
Retest = yes
15 min = yes
MACD confirm = yesNumber of pis SL to EP = 28
AUDJPY

Time Frame = 1hr
Divergent = Yes
.618 = yesRejection =
Retest =
15 min =
MACD confirm =Number of pis SL to EP =
EURUSD

NO TRADE
Time Frame = 4hr
Divergent = Yes
.618 = FAILRejection =
Retest =
15 min =
MACD confirm =Number of pis SL to EP =
Sunday, July 22, 2018
Trade Plan 7-23
USDCAD

NO TRADE
Time frame = 1hr
divergent = Yes
618 = Fail
Rejection =
Retest =
15 min =
Macd confirm
Pips from EP to SL
ChfJpy

Time frame = 1hr
divergent = Yes
618 = Still on neckline
Rejection =
Retest =
15 min =
Macd confirm
Pips from EP to SL
AUDUSD

SUCCESFULL TRADE
Time frame = 1hr
divergent = Yes
618 = Still on neckline
Rejection = Rejection in 1hr which 4hrs candle body is below 1hr rejection
Retest = Rejection consider after rejection becaouse 4hrs candle stick body below 1hr rejection
15 min = Yes
Macd confirm = Yes
Pips from EP to SL = 35 pips
Other Watch list
https://docs.google.com/spreadsheets/d/1srpS21AQxONSe0cEKlhu0IE5DbLyRFVKEnVTrNnakvY/edit?usp=sharing
Wednesday, July 18, 2018
July 18 trade Plan (Correlating Pattern
Priority
EurAud (Correlating Pattern)AudNzd (Correlating Pattern)

EurAud
Time frame = 1Day/4hrs/4hrs/1hr
divergent = No/Yes/No/Yes
618 = Yes
Rejection = 1 day and 4hrs yes wating for 1 hr about to form
Retest =
15 min =
Macd confirm
Pips from EP to SL

AudNzd
Time frame = 1Day/1hr
divergent = No/Yes
618 = Yes/ waiting
Rejection = Yes/waiting
15 min =
Macd confirm
Pips from EP to SL

AudUsd
Status = Stag 2 complete
Time frame = 1hr
divergent = No
618 = Yes
Rejection = Ywaiting
15 min =
Macd confirm
Pips from EP to SL
Additional Pattern Detected
https://docs.google.com/spreadsheets/d/1srpS21AQxONSe0cEKlhu0IE5DbLyRFVKEnVTrNnakvY/edit?usp=sharing

Subscribe to:
Comments (Atom)