Sunday, August 27, 2017

Harmonic Pattern


Since it bounce on the neck line and had 2 rejections the Market now is looking for the Roof or the Resistance, in which what we can see is the exact calculation of Bat Pattern and the exact point of entry of head and shoulder.

Pivot indicator as well as MA 100 have greatly influence my trade. May i suggest if you dont know about structure pls watch this video about market structure before watching the video above

Since this week will be the Non Farm Payroll week so we have to watch our trade for it may not support our analysis.

Saturday, August 26, 2017

Ask Corner

Your Opinions or Questions is important to me Write down below


Friday, August 25, 2017

Aud Usd Butterfly pattern 60 min


details to be follow

lately im calculating how much i risk compare to how much i will Profit. and for this trade I found it very favorable as to how much to risk. although my trade is still in progress .

Thursday, August 24, 2017

ABCD Pattern higher structure and Head and shoulders Lower structure


Explanation and video will be created stay tune

Tuesday, August 22, 2017

Butterfly pattern


Butterfly Pattern on 1hr chart EURUSD\

I was too sleepy to put details on this post. Detected this one 4Am and took my trade at around 5Am. Used a candle stick pattern to identify my point of entry which is right after the 2nd bearish candle, after the bearish pinbar candle. As i have calculated it it only will take 13 pips to risk. Since i have traded already 40 pips on the break out i manage to utilize the Money Management strategy. Even my limit was only 10 cents trade size I have traded 50 cents per pip without risking my capital if i loose.

Watch this video to understand Money Management Strategy
https://youtu.be/5GGWTUDGoIw

Take Profit in other hand have 2 option which is the 67.8% and the 127% of point CD in which if you take a look on this pic you can see that Option 1 is already filled which I have earn another 40 pips for this week


Now im waiting for the 2nd take profit which is the 127% if ever this is filled then i have reach my goal for the week taking 120 pips per week.


Monday, August 21, 2017

How to trade Break Out


Pull back strategy - basically wait for the Higher low structure to form before taking trade Stop lost is in the previous low structure

Upon break out next candle- when i do this i make sure im following the the stop lost. which i closely monitor due to possibilities of false break out will happen.

Which currently im doing on my trade


 a triangle have been break so I have trade right away on next candle however i closely monitor this trade for the reason possibility of false break out is showing on 4hrs time frame.

already i have move my stop lost to safe zone so what ever happens i do got 22pips


Sunday, August 20, 2017

If Trade size is $5 per Pip then i had lost P18,000 Pesos

     
As for my famous slogan Experience is the best teacher. If you can see slogans or ads about how high you can earn in forex. Pls bare in mind this slogan or ads is two ways. what they are showing you is only the one face of the coin. They are not lying about it. It is really true that you can earn as much as what they are saying however they are not also not telling the whole truth about it. So What is the truth?

     During My first Year on this Forex trading I had created a feasibility study how profitable it can be. Using simple trading on my little experience the research that i created is really feasible. However the only problem is I treated the market as if it is a decease that need to be cured. I treated the market like a machine if its now working then here is the solution. I was concentrating more on strategy and indicator which the greatest newbie error I have put so much attention on strategy and indicators that others are using which they are really earning.

    I never say that you are not to learn from them. what im trying to point here is to be consistently earn in this industry you have Learn how to trade forex by its Structures, i discourage to copy how others trade or even discourage to copy how i trade but rather enhance it the way you like it to be. It must be tailored fit in accordance to who you are. Not in accordance in how much dollars you can make.

As a result of this costly newbie mistake 3 of my clients lost their money. So Lets go back what is the whole truth about Forex Trading


 As much you can earn 500X you can also loose 1000X


So Am i Discouraging you to trade on forex?? Watch this video and I promise you you will know the answer.


Wednesday, August 16, 2017

Market Structure shows Direction

Can you really tell where the market is going? How accurate you are regarding market directions. Does Market give clues?.Given that we really dont know what will happen tomorrow does that mean we can't tell where the market price is leading? The fact that we dont know what future brings we can not pin point the EXACT market Price. However what we can do is to tell where the market is going.

To know the Directions I have discuss the Structures and its relation ship between time Frame, you can refer to this video to understand it. (how to trade Forex). It is also a must You understand Time frame

Time Frame
1 Day Candle stick = 24 candle stick having a time frame of 1 hour
1 Day Candle stick = 6 candle stick having a time frame of 4 hours
1 Candle stick in 4hrs time frame = 4 candles sticks in 1 hr time frame
1 Candle stick in 1hr time frame = 12 candles sticks in 5 min time frame
(Explanation video will be created soon about Time Frame)

If you have understand time frame you can explain a pin bar or hammer Candles stick. Example in four hours time frame the reason for the formation of very long wick or tail, probable cause

Bullish long tail or wick = 1 candle stick (1hr time frame) bearish and 3 candle stick (1hr time frame) bullish. The bullish candle  height is longer than the bearish candles stick. It may show Long bearish candle in the first hour of the 4hrs time frame but the 2nd 3rd and 4rth candle (1hr) out stand the height of the 1st hour candle stick leaving a long tail or wick.

It may sound confusing but as soon i can create visual video on this this will make sense. Expert in candle sticks and its relationship with time frame will make you great naked trader. as for me I need further indicators to serve as a confirmation on what i am going to respond to the market.

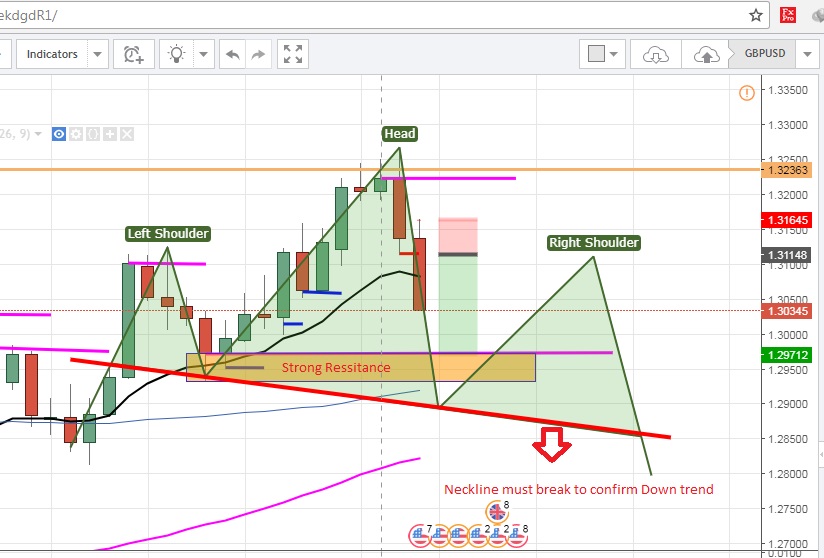
Now lets take a look on this 1st PIC

Posted this Pic last August 4 this year during the non Farm Payrol week (refer to this link) I have specifically explained on that post that if the Strong resistance is broken then higher possibility of down trend is coming, in which Swing traders love this clues. as for me to take trade again i specifically draw a head and shoulders pattern which we all know if market price form a head and shoulders possibility of reverse is high. for this case a down trend is coming.


Take a look on 2nd  pic which is the current August 16, 2017 shows the accuracy that i have foretold regarding direction. and if Market allow to happen forming a right shoulder then its time for me to trade.

IMPORTANT

Direction of the market  can only be measured with in Structure. again watch this to understand structure (how to trade forex). Meaning the accuracy and to what will happen next will depend the structure level if the market have broke or reject previous structures. That is why it need skills to identify this. so that you can still earn without know the exact point when will the market break or bounce.

Example my analysis on EurUsd last Sunday (refer to this link)

I state it clearly that it will bounce on the Roof or Resistance  making an advance trade. However what the market does it did not, but instead he check the previous structure low. in which my trade plan is still intact since i could see pattern forming

Even it did not hit my desired point of entry which i already took and advance trade waiting for market to hit it and it will start the trade. I was still able to profit and created a new trade with minimal 1:1 Ratio risk factor.  Reason behind it was the experiences I had and back up with few indicators. Again the structure help me decide to create a new entry. (watch to understand)
Refer to the pic below


Sunday, August 13, 2017

Technical Analysis Eur vs USD


Tools Used 
  1. Fibonacci
  2. Support and Resistance
  3. Pivot
Advance Pattern
  1.  double top
  2. ABCD Pattern
  3. Butterfly and Bat
the trade that you can see in the video is going down. however this trade has to have confirmation first.

Confirmation needed
1. if it will not break out the Resistance or close price after break out. then I will make a trade.
2. if it will have rejection and momentum going up is fading I will make the trade
3. Since Stop lost is more than 50 pips, then i could not create advance setup. Ill be observing this pair 
4. if everything is on opposite then ill will be waiting for pull back on 1hr time frame before take trade. 

Pattern 
1. Butterfly which i prefer to trade the ABCD. the X point is based on the Support and Resistance and pivot. which the entrancement is more than the requirement of Butterfly (AB must be 0.716)

2. Bat pattern is the full arm based on 1 day time Frame which the completion of butterfly is exactly .618 retractment

3. ABCD pattern on Butterfly have same entry point on the extension of XA. which is the 127. while the ABCD pattern ends on 1.618 which is both have the same price location. thats why this give me another confidence.

Note: 
MACD Cross over on 4hrs did not cross yet meaning chance is still high to go up,
RSI in 1hr shows that it reach the maximmum buyers so there will be selling anytime soon.
Be advice trend is going up but it is giving huge potential to start on trading low.

Other Currency that is in my watch list
GBPJPY = Pound yen


Monday, August 7, 2017

How to trade Forex (Day 8 and 9)

You Aint gonna PROFIT unless you Know How to trade Forex.

  • Indicator
  • Strategy
  • Money Management
  • Time Frame
Are all USELESS when you dont know how the Market works. Don't be confused on how to trade Forex and How to profit from Forex. You got to know first the very nature of the market before you are going to plan how to take profit from it.

Problem with forex trading is we intend to focus Profiting, We intend to focus on how much dollars we make or Pips we can do. We intend to discipline ourselves  on the system we had created and for some which make it worst we intend to focus on the system that others created.

You may wonder and ask if trading is a skill and based on your own personality how come I cant build my account? You knew who you are and have chosen the best indicator that suit on your own personality, yet you cant just build your account up.

Like me i have spent my time knowing what kind of trader I am, searching who really I am. What is the best tailored fit system, strategy and indicator. I have tried learning from candle stick to sophisticated indicators that I know. which often lead my judgment and confidence to no where and loosing a lot than winning...

This is why I created this Topic that often not tought by the many, How to trade a Forex is the base line of everything. 
  • Before you can implement your strategy you have to learn and be in one with the market.
  • Before you can tailor fit indicators based with your personality you have know the heart beat 
  • Before you can create system or rules on your own trading style you have to learn how to trade Forex
The importance in Learning  How to trade Forex First is Critical. What you are going to see does not have to do on any tools you are going to use. And definitely this has nothing to do how you are going to trade it. Remember there is no right or wrong on trading. What im going to share is the building block, the pillar! the Post and the must . The effectiveness of your tools, strategy, indicator will depend how much you understand how the market works. how the prices are connected with individual time frame. In short, How to trade Forex.

Below are some of the signs that you dont know how the market works. A signs that you dont know the relationship of every price on given time Frame, A sign that you lack or dont know How to trade Forex and make it Profitable.
  1. You don't have a hint where the market is going
  2. Confused on the relationship between time frame
  3. Dont look on higher time Frame
  4. Dont understand why the support and resistance changes every-time
  5. Cant Explain why the support and resistance changes every-time
  6. Could not identify the signs that market is about to change. 
  7. Dependent on the indicator not as confirmation but a tool where to start a trade
  8. Often listen on how others think rather than trusting your analysis
Don't Miss understood what im going to share to you. this is not a holy grail, nor strategy and most of all this is not an Indicator. but simply the base line of everything, a heart beat of the Market. The stronger you understand this the higher possibility you will be one with the market. This is not telling you the exact location of the price but rather getting a higher probability to happen. Giving you enough time to respond right and not to react. Reaction and Responding are two different thing. Just like how to trade Forex and How to Profit in Forex.

Reaction by nature are driven by emotions or feeling that often cloud our decision. Reaction can be right but it can be wrong. In which we know in trading if your wrong it will be devastating. Reaction often is form instant or quick in a short period of time. That you have made your decision because you react on what you see or feel.

Responding, this is where you need a skill. See in forex,  if you dont know how to trade. you will be reacting more not on Responding More. Since Responding is a calculated reaction, to efficiently solve the task or dilemma. Responding is calculating the the possible things to happen. does giving you room for improvement. While reaction is fixed. 

So How to trade Forex? watch the video below and learn to respond more not to react more.


Saturday, August 5, 2017

Non Farm Payrol GBPUSD


The thought of Selling, trade down is for the reason a butterfly pattern has formed. however due to previous high and Low on 1 day time frame I have consider to start my trade on the 161.7 Extension of point BC. Now to be able to Manage the amount of pips I am risking I took the previouse High in I day which exactly gave me the enough pips to risk based on my capital. From my Money management I am only allowed 40 to 50 pips to risk.

as for the Take Profit I have considered the Non Farm Payroll once the mark 61% retracement is hit. The possibility that this is a reversal is half confirm for the reason a 1 day support is yet to be broken. however because of the nature of batterfly pattern which is an active reversal. the previouse pattern contributed a lot of factor for my confidence that this will have a long down pips.

Did i really know that this will happen? to be honest it shakens my confidece due to its long consolidation on 4hrs that took almost a day before it confirm that my trade was right. I even have small losses since i traded up on the candle that break the consilidation. howerve i did not turn of my sell trade but of course i did put a stop lost on my buy trade.

What Next?

I have lot to consider if i will find a reversal pattern on 1 day which what i can see is an head and  shoulder advance pattern then thats the time Higher percentage of reversal is confirm. Not to mention neckline must be below the support of 1 day...

if it did not break then most cases it is start on 2nd wave for uptrend refer pic below